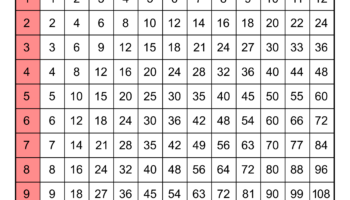
A chart that systematically displays the results of adding numbers together, typically integers, is a valuable tool for education. The grid format shows the sum of two numbers at the intersection of a row and column, offering a visual representation of addition facts. For example, an individual using this tool can quickly locate the sum of 7 and 8 by finding the intersection of the row labeled ‘7’ and the column labeled ‘8’, which will reveal the answer, ’15’.
This resource provides significant advantages in early mathematics education. It aids in memorization of basic addition facts, promotes pattern recognition within the number system, and builds a foundational understanding of arithmetic principles. Its accessibility and simplicity have made it a persistent fixture in classrooms and homes for generations, supporting learners as they develop mathematical fluency.
The following sections will delve into various aspects of these educational resources, including their different formats, effective utilization strategies, and suitability for diverse learning needs.

